


The following is a genuine analysis of Excel spreadsheets applied to lottery and lotto developing of software, systems, and strategies. Combining Excel spreadsheet analysis with powerful lottery and lotto software programmed by this author. It was first posted to rec.gambling.lottery newsgroup way back when...
I have come up with a large number of patterns or lotto filters, as you can see in my SuperPower lotto software (the WS files). It would be a huge task, unmanageable for a single programmer, to write a program that would check all the parameters, combine them in all possible lottery systems, and select the most-likely-to-win strategies. When I started, it was the world of 16-bit DOS computing, with the file size limit of 640 KB. I would have needed many, many megabytes.
Now, it is 32-bit Windows lotto software, but it is very, very slow compared to Command Prompt (in the case of lottery software, which is highly CPU-intensive). DOS is now called Command Prompt. I have had no choice (and not much time) but let the computer show me the reports of the parameters (i.e. how the lottery filters fared in the past). Based on the past values of the parameters, I would select future values for the lotto filters using some statistical methods. One such simple method anyone can notice is that 3 consecutive increases are immediately followed by a decrease most of the time (over 90% of the time) and vice-versa. Of course, 90% is not 100%, that's why it is impossible to select winning lotto strategies every time.
I advised in my SuperPower lottery software package a way to play the pick-3 game. Look at the front/back pair parameter. It has a median of 33. It also shows values of over 100 it means none of the front or the back pairs of a pick-3 lottery drawing is a repeat from the past 100 drawings. Using such a filter, would reduce the number of total possible combinations to 125 (or a probability of 1 in 8). So, one lottery strategy would be based on the pairs (Pr) parameter with a value of 100. Other parameters in the same file would have also higher values. At run time, in addition to setting PR to 100) select higher but safer values for other parameters and also use the simple rule of 3 increases/decreases. I have tried to make using my lotto software as easy as possible. Remember, I am the most loyal and frequent user of my lottery software!

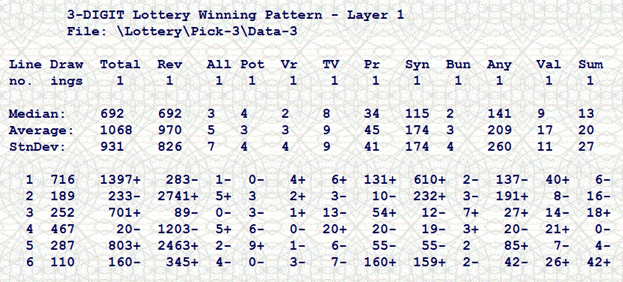
Let's say the day before the lottery drawing took place, I wanted to see if the moment was right to play a strategy based on the filter Pr1=100. I would run my software that checks any strategy. The number 5000 is a dummy: it represents a maximum value which is never reached. If I don't want to check for maximum values, the lottery software will use that default value of 5000. You can read the strategy as: We are only interested to see how many times Pr1 was 100 or more, regardless of any other filters.
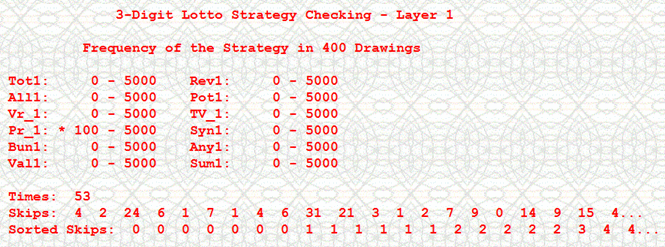
Our strategy occurred 53 times in the last 400 lottery drawings (let's approximate it to one year). The Skips section shows how many times the lotto software strategy waited between hits. Zero means that the strategy hit in two consecutive drawings.
Median Skip: 5 drawings
Skips of 0 to 5 = 32 times (for a total of only 82 skipped lottery drawings!)
over 10: 10 times (for a total of 178 missed lottery drawings!)
The worst playing situations occur when the skips reach 10 or more drawings. That would be most costly way to play the strategy. Based on my Gambling Formula, a skip can reach even 55 drawings! That was one of my sins up until not long ago: I believed that it was best to play only lottery strategies with high skips (over 20)...
It is better to play lower skips, around or below the median (a requirement of the Gambling Formula).
Playing only when Skips shows 4 or 5 as the first number:
playing 21 times @ $150/play = $3150
number of wins: 14 x $500 = $7000
net profit: $3850/year (400 drawings).
That profit comes WITHOUT applying any other lottery filter to Pr=100
We want to play with more modest budgets, so we apply some other filters. As I stated before, when a filter such Pr is high, other filters in the same WS file have a tendency to reach higher values. We can set other filters conservatively (i.e. safe values). For example:
Tot1=200, Rev1=200, Vr1=1, Syn1=100, Bun1=1, Any1=100.
Applying other lottery filters in addition to Pr1=100:
- playing 21 times @ $50/play = $1050
- net profit: $5950/year (400 draws)
Actually, just using Pr=100 without other filters generates 130-150 lottery combinations. Using additional filters (safe) generates from 10 to 45 combinations.
I received an insightful message from a Brazilian user of my lottery and lotto software. He found my strategy to be FLAWED. After further review, he was right! I rechecked the entire process. I miscalculated. Indeed, I should have counted also the times when the skip went 6 or higher. Actually, I looked at front skips which were already higher than 6. The right lottery strategy is still based on the MEDIAN. Briefly now, if there are more than 5 skips below the median do not play. Also, after 1 or 2 skips above the median, there will follow skips lower than the median play the strategy!
Or, play ALL the streaks, but only from 0 to 5. There are 53 streaks.
Playing only from 0 to 5 lottery drawings means 6 runs. Multiplying 53 streaks by 6 runs gives 318 runs. There are 32 winning situations for streaks between 0 and 5. Total winning is $500 x 32 = $16,000. In order to make a profit, we must play no more than 50 lottery combinations per run. In other words, if using additional lottery filters to PR=100 generates 10 combinations to play, the cost will be 10 x 318 = $3,180. If the strategy generates 20 lotto combinations per run, total cost would be 20 x 318 = 6,360. Just 20 combinations per run are pretty common, given the strong co-variance of the filters in the same WS file (the same layer). There is a stronger still co-variance between PR and TV, or between TOT and REV, etc.
Always use other lottery filters in addition to the main filter (PR, in this case). I have received quite a bit of input on the subject of strategies applied to my lotto software. Some users with computer programming skills have written their own utilities to check the values for other filters. Others use the Excel spreadsheet to do comprehensive analyses. Basically, a user opens as a text file the WS reports generated by SuperPower or LotWon or MDIEditor And Lotto WE lottery software packages.
If they want to apply the PR the main filter, they will sort the spreadsheet on the PR column. Next, select all the cells where PR is 100 or greater. Paste the block in to a new spreadsheet. Do a data analysis of the new worksheet: get the minimum, maximum, average, median, mode for every column. You'll notice that PR=100+ is accompanied by higher values in other columns as well. Applying other lotto filters in conjunction with PR will substantially reduce the combinations to play (under 10 in quite a few cases).
While developing the lottery software, I was met with astonishing situations. In Pennsylvania lotto 6/48 game some filters were very high from time to time, as it normally happens. In one case, however, they were so high that the software generated only ONE combination to play! In another case, in the old Maryland 6/40 lotto game, the filters were as such that only 8 lottery combinations were generated and had the sizable lotto jackpot. Cases like those made me stay in this lottery, lotto software business. It is possible, albeit very rarely, that a huge-odds lotto game can be won with just a handful of combinations!

I also presented on one of my main lottery strategies page (Lotto, Lottery Software, Strategy, Systems, Wheels) another strategy. I presented real data for a 6/48 lotto game. The individual probability is p=1/8. According to the Fundamental Formula of Gambling (FFG), half of the lotto 6/48 numbers (3) in every drawing will be repeats from the most recent 6 drawings.
Moreover, there were drawings in which all six winning lotto numbers had been repeats from the past 11-12 drawings, even from the past 6-7 drawings! In the last 500 drawings of the late PA Wild Card lotto game (6 of 48), in 123 cases (25%) all 6 winning numbers were repeats from the last 12 drawings. In 25 cases (5 times a year), all 6 winners were also drawn in the last 7 lotto drawings. More amazingly, in 7 cases, all 6 winning numbers were repeats from the last 4-5 drawings! Again, it can be checked against any lotto database with my lotto software.
The best tool of choice is Excel. The spreadsheet software has a large variety of powerful statistical functions applicable to lottery. You need to install the add-in called Data Analysis. Once installed, it will show up in the Tools menu. Here is what type of analysis I just did for my lotto-5 data file. The lotto game draws 5 numbers from a field of 39. If it is for the first time you've seen my name, I recommend you visit my lottery site first: Winning Lotto and Lottery Software, Strategies (LottoWin.htm).
The lotto-5 data file is a simple ASCII (text) file with EXACTLY 5 numbers per line:
1 12 20 28 35
It is also assumed that your lottery drawings are sorted in ascending order. You shouldn't use the drawings as they appeared during the TV drawing show. In Excel, open File menu. Select Open. Choose Files of type: All (*.*). Select DATA-5 (or the correct name of your lotto-5 drawings file). Excel is an intelligent application: It will format your Data-5 file in the correct lottery software spreadsheet grid. Your sheet will have 5 columns: A, B, C, D, E (A represents the first number in the drawings, etc.) Let's say your Data-5 file has 500 drawings.
Select column A. Click on Tools, then Data analysis. In the ensuing dialog box select Descriptive statistics and finally Summary statistics. Excel will create a new sheet, named Column1. There are some important numbers in the analysis sheet1, especially Median and Mode. The Median divides the column in two halves. The Mode represents the most frequent number in the column. Here is what kind of data I got for my data-5 lotto file:
The first number (col. A): Median = 5; mode = 1
The 2nd number (col. B): Median = 12; mode = 10
The 3nd number (col. C): Median = 20; mode = 18
The 4th number (col. D): Median = 28; mode = 30
The 5th number (col. E): Median = 35; mode = 39.
If you visit my site, you'll come across what I call the Fundamental Formula of Gambling. The medians you see above are very close to what the Fundamental Formula of Gambling gives for a game of any probability p.
The median can also be calculated in advance; i.e. the theoretical value. The only tool you can use is the well-known-by-now Fundamental Formula of Gambling! I call the parameter FFG median.
I give you one more tip now: Use the Median in conjunction with the Mode. How about this kind of lotto number selection? For any position, select numbers between Median 4 to Median + 4. As you can see, the Mode is right within that range. This is not a secret: It is a representation of the so-called Normal probability rule. The most frequent lotto numbers drawn in that position fall within the range we just set. In the case of my data-5, my best numbers will be within the following ranges:
The first number: 1 to 9
The 2nd number: 8 to 16
The 3rd number: 16 to 24
The 4th number: 24 to 32
The 5th lotto number: 31 to 39.
It is better to analyze larger lotto data files. More than 500 is best, in order to get as close as possible to the gambling formula. In general, in more than 60% of the drawings, the winning lotto numbers will fall in the ranges we set above. While in Excel, you can sort data-5 by each column. You can see how numbers are distributed around the median. Click on the menu item Data, then Sort. Type the range $A$1:$A$500 (in the case of column A from drawing 1 to lotto drawing 500).
First of all, I am not a software salesman. I only posted in the thread because I assumed the initial writer already had Excel on his PC. I showed how to use an Excel add-in: Data Analysis. Its Summary Statistics generates very useful reports regarding lottery drawings files. You can read my post again.
I need to mention now that my findings are, in fact, a consequence of the so-called normal probability rule. The rule is in turn derived from the Gaussian (Normal) Distribution. The normal probability rule establishes the probability for an event in correlation with the most probable result in a probability distribution. A file with lottery drawings represents a probability distribution. The median is one of the most probable results in drawings series.
Let's take as an example the median of the first numbers in the drawings. In the case of my lotto-5 drawings file, the median of the first number is 5. The standard deviation was 6. The rule of normal probability states that the probability of any first lotto number in the lottery drawings is 95.4% less than 2 standard deviations away from the median, and 99.7% less than 3 standard deviations away. My lotto-5 drawings file has over 1000 drawings. Over 97% of the numbers drawn in the first position are between 1 and 18 (which approximates 3 standard deviations from the median).
Over 98% of the lotto numbers drawn in the 5th position are between 21 and 39 (again, approximately within 3 standard deviations). This is valid for one number position at a time. If I want the simultaneous probability of the 1st and 5th numbers, it is .97 x .98 = .95. There is a 95% probability that the 1st AND the 5th numbers will be between 1-18 AND 21-39. The simultaneous probability for ALL five lotto numbers was around 60% for my lotto-5 file. In over 60% of the drawings, the winning numbers were as follows:
1st number: between 1 - 18
2nd number: between 3 - 21
3rd number: between 11 - 29
4th number: between 19 - 37
5th number: between 21- 39
Total combinations of 18 taken 5 at a time is: 8,568.
My lotto-5 game uses 39 balls. Therefore, total combinations of 39 taken 5 at a time is: 575,757. Now, important to note that Excel does not have a function to generate lottery numbers. The user needs to program such functions in Visual Basic for Applications (VBA) (incorporated in every Office application). Or, do what I do: write specialized lottery software outside Excel or Microsoft Office, using general-purpose programming languages (Visual Basic or PowerBasic compilers).
But if you do not program at all, it is obvious that it is far better to select lotto numbers from the ranges determined by the normal probability rule. If you are to choose 5 numbers from the most frequent 5 ranges, the winning probability is 1 in 8,568. Choosing 5 lotto numbers from a field of 39 has a winning probability of 1 in 575,757. In 60% of the cases, you will face odds of only 8,568 to 1 if you choose numbers from the most frequent ranges.
I just wrote the program to generate 5-number lotto combinations within ranges. The lotto software uses no filtering at all. Indeed, I was wrong regarding the total lotto combinations to play! I mean, wrong, although not quite as wrong as some other calculations indicated.
I used first the following lotto ranges:
1 to 18
3 to 21
11 to 29
19 to 37
21 to 39.
The program generated 371,036 lotto combinations. That represents 64.4% of all possible combinations for a lotto 5-39 game. The positive side is that the ranges eliminated 204,721 combinations. That's a very powerful filter, as far as I am concerned.
1 to 9
8 to 16
16 to 24
24 to 32
31 to 39.
The lotto software generated 53,352 combinations. That represents 9.3% of all possible combinations for a lotto 5-from-39 game. You should expect to win 1 every 10+ lottery drawings using those ranges. The best situation to play the ranges is after 4 to 8 skips (losses). In other words, if the ranges don't come up after 4 drawings, play them until they skipped 4 more drawings.
Evidently, the ranges by themselves are not sufficient. They need to be used in conjunction with other lotto filters. Using other filters, I obtained from 0 (zero) to 8,000 combinations to play. Of course, the winning frequency is lower. In my book, the best way to play the lotto games is to set filters that eliminate the largest possible number of combinations. Of course, you will have the chance to win more rarely, but a lotto jackpot win compensates.
If you are interested in the lottery software program, I uploaded it to my software site. The name of the lotto software program is RANGES5. You need to download also the file RANGES.5, which consists of the ranges for the 5 numbers. The file is in ASCII format, so you can use any text editor to change it. This program is now a function in the Bright / Ultimate lotto software packages, specifically Lexicographical Generating. Then, you select option R = Lotto Combinations between Positional Ranges.
1 9
8 16
16 24
24 32
31 39.
To generate ALL possible lotto combinations of N numbers, make the five lines read:
1 N (substitute N for particular numbers).
For example, to generate all the combinations in a 39-number lotto 5 game, edit RANGES.5 to read:
1 39
1 39
1 39
1 39
1 39.
The result file can be diminished further by using the PURGE lottery software routines in MDIEditor and Lotto WE or LotWon lotto software.
For details, read: Software Utilities for Lottery, Gambling, Lotto, Powerball, Mega Millions, Thunderball, Pick 3, Pick-4.
Better still, look for the integrated lottery software packages entitled Bright and especially Ultimate. For example, 6-number lotto games are exceptionally handled by Bright6 everything lotto-6 incorporated in one bundle... and then some!

 Read Ion Saliu's first book in print: Probability Theory, Live!
~ Founded on valuable mathematical discoveries with a wide range of scientific applications, including probability theory applied to lotto, lottery, programming.
| Home | Search | New Writings | Odds, Generator | Contents | Forums | Sitemap |